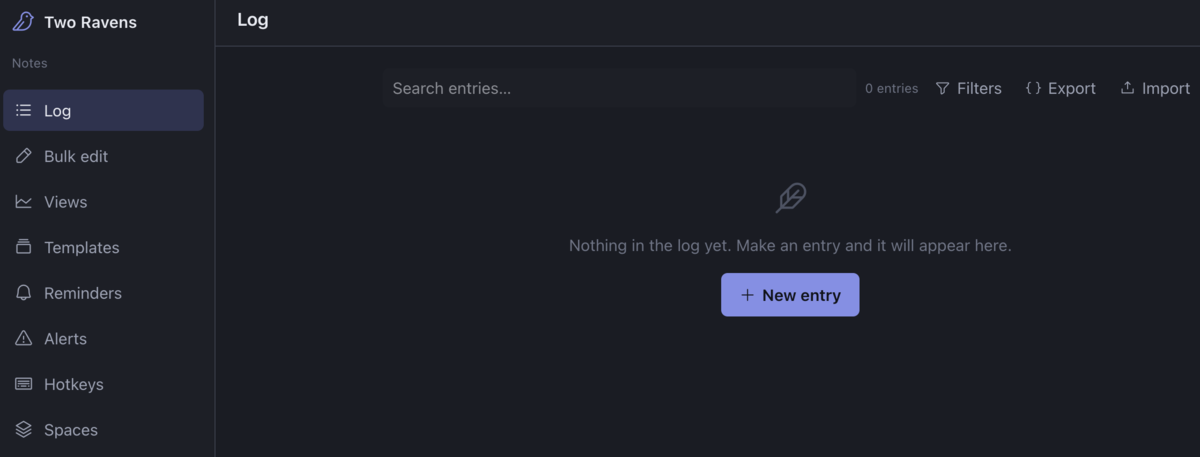
Personal statistics platform
I switched my zettelkasten to Obsidian several years ago, and I've been pretty happy with it except that, in addition to notes, I tend to track a lot of personal statistics that in a zettelkasten are at best distracting minutiae and at worst big blobs of GeoJSON that crash the app. For example, when did I pay a bill? When did I change the oil in my car? That transforms Obsidian from a second brain into a plain old database, and one that's not natively very good at visualizing the data stored in it. Bases can store information in separate notes, and Dataview can extract information from inside notes, but visualizations like calendar heatmaps require plugins and often custom code. Before I used Obsidian, I kept a set of text files in which I kept a DSL for logging these statistics, but visualization was still awkward, and often I didn't remember exactly what information I tracked for a given stat. Did past entries record what account I paid the bill from? What order do I put the function's arguments in, or what did I call the map fields? When I chose to use AI to make a non-trivial tool, I decided to make something that would address these problems, with smoother data entry and built-in visualization, so I could get these noisy personal statistics out of my Obsidian vault and let it focus on more unique content.
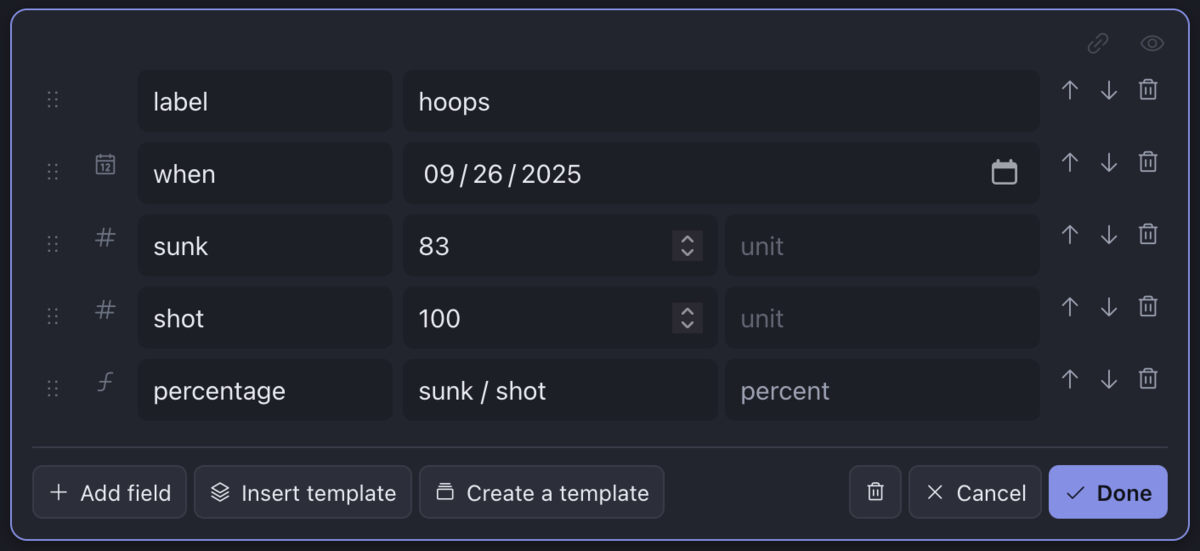
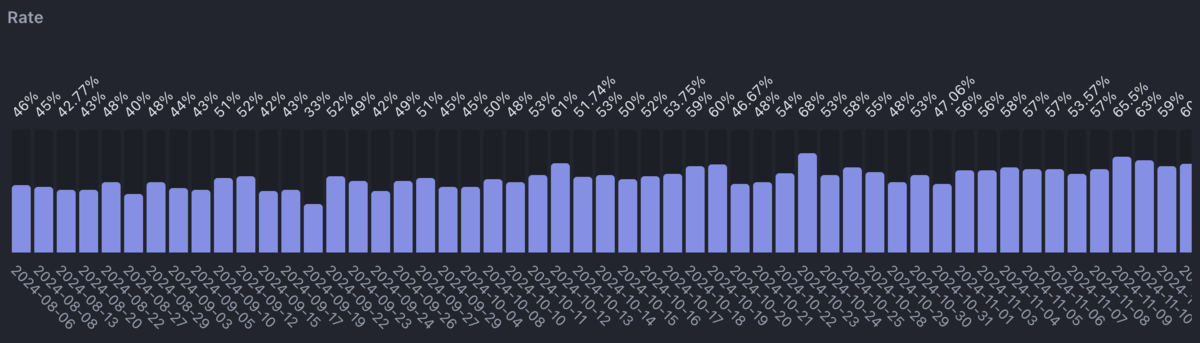
One stat I'd tracked in Obsidian was my free-throw percentage. I spent a year casually shooting hoops and counting how many I hit, which I logged in my daily note with a Dataview annotation, Hoops:: 46/100. A little bit of code plotted a graph. When I laid out Jobs To Be Done with the tool I wanted, that job seemed simplest. Still, it suggested several distinct features:
- A way to define a template with the fields that were needed on each entry
- A way to load create an entry from a template
- A calculated field that used other fields on the entry to show a percentage
- A way to plot the data
- A reminder to add an entry
A couple more Jobs To Be Done had similar needs, but also some new ones, and the terminology quickly got confusing. I wrote a glossary file to keep it straight. Among other ambiguities, I kept using the terms "visualization", "view", and "plot" interchangeably, but I actually needed to differentiate them:
- "visualization" was too long for my taste, so I stopped using it, rather than abbreviate it as "viz"
- "plot" would refer to an individual data visualization
- "view" would refer to a set of plots on a particular topic
The main architectural backbone of the app was that I wanted it to be local-first and sync across multiple devices, such as from my laptop to my phone. That dictated a database schema. I also specified that I wanted the code to have a functional core with an imperative shell. I like to think that was a key request in creating a code base that an LLM has been able to maintain. Beyond that, I asked it to keep dependencies to a minimum. That led it to avoid any libraries or frameworks for DOM manipulation and write its own library, and even to document that there were no dependencies in the README, which a later session of Claude called a "boast".
I didn't dictate a tech stack. If I was going to work in the code directly, I would have requested ClojureScript, but since I planned for an LLM to write all the code, I let it choose. After all, I've worked in much larger code bases where I didn't get to pick the programming language, and I've always managed to find my way around eventually and be productive. I could do the same on this project if necessary, and probably with a lot fewer quirks from other engineers and evolving eras of code style. I did venture into the code a couple times to make trivial changes, and I didn't have any trouble finding the code I needed to change and updating it.
The first iteration was surprisingly close to what I envisioned, but it was quite different from what it is today. Daily use led to a lot of small tweaks that added up. For example, text fields were often too confining, so I asked for an additional field type to allow Markdown content. To test, I needed to import JSON data. Then I needed to edit entries in bulk. Soon, I wanted the option to have units on numbers, such as "3 miles" or "2 cookies". I asked for widgets to be moved, configurable keybindings, new types of data visualizations, and a version that could run entirely from the browser when no server was present. That was just the first couple days.
At this point, the app has served me well for about six weeks, and I've begun porting old records into it. There are occasional regressions, but asking for a fix and a test, just like on a regular development team, has generally solved the problem. More often than not, the bug was caused by my own poor communication (again, just like on a normal development team).
The code base is about 44,000 lines of TypeScript and 1,600 tests. Not huge, but more than I'd write on my own. I'd be curious to have an LLM port the app to ClojureScript and see how it compares, but that's not a priority.
If, like me, you've also kept personal statistics but had a hard time knowing where to put them and found it difficult to visualize what you've collected, give Two Ravens a try and let me know how it works for you. The current version is tailored to a variety of my own use cases, so I'm curious how your approach would be different.